ProductRun
Analytics built into the platform, not bolted on.
Dashboards with one period and one set of filters across every tile. Workbooks that feel like Excel, with pivots, formulas and exact totals over Business Central and CourageMFG data. Budgets planned in a spreadsheet and written back to BC.
Replaces
- budget spreadsheets and a separate CPM tool
- Power BI dashboards and the weekly KPI deck
- Power BI reports and the Excel exports behind them
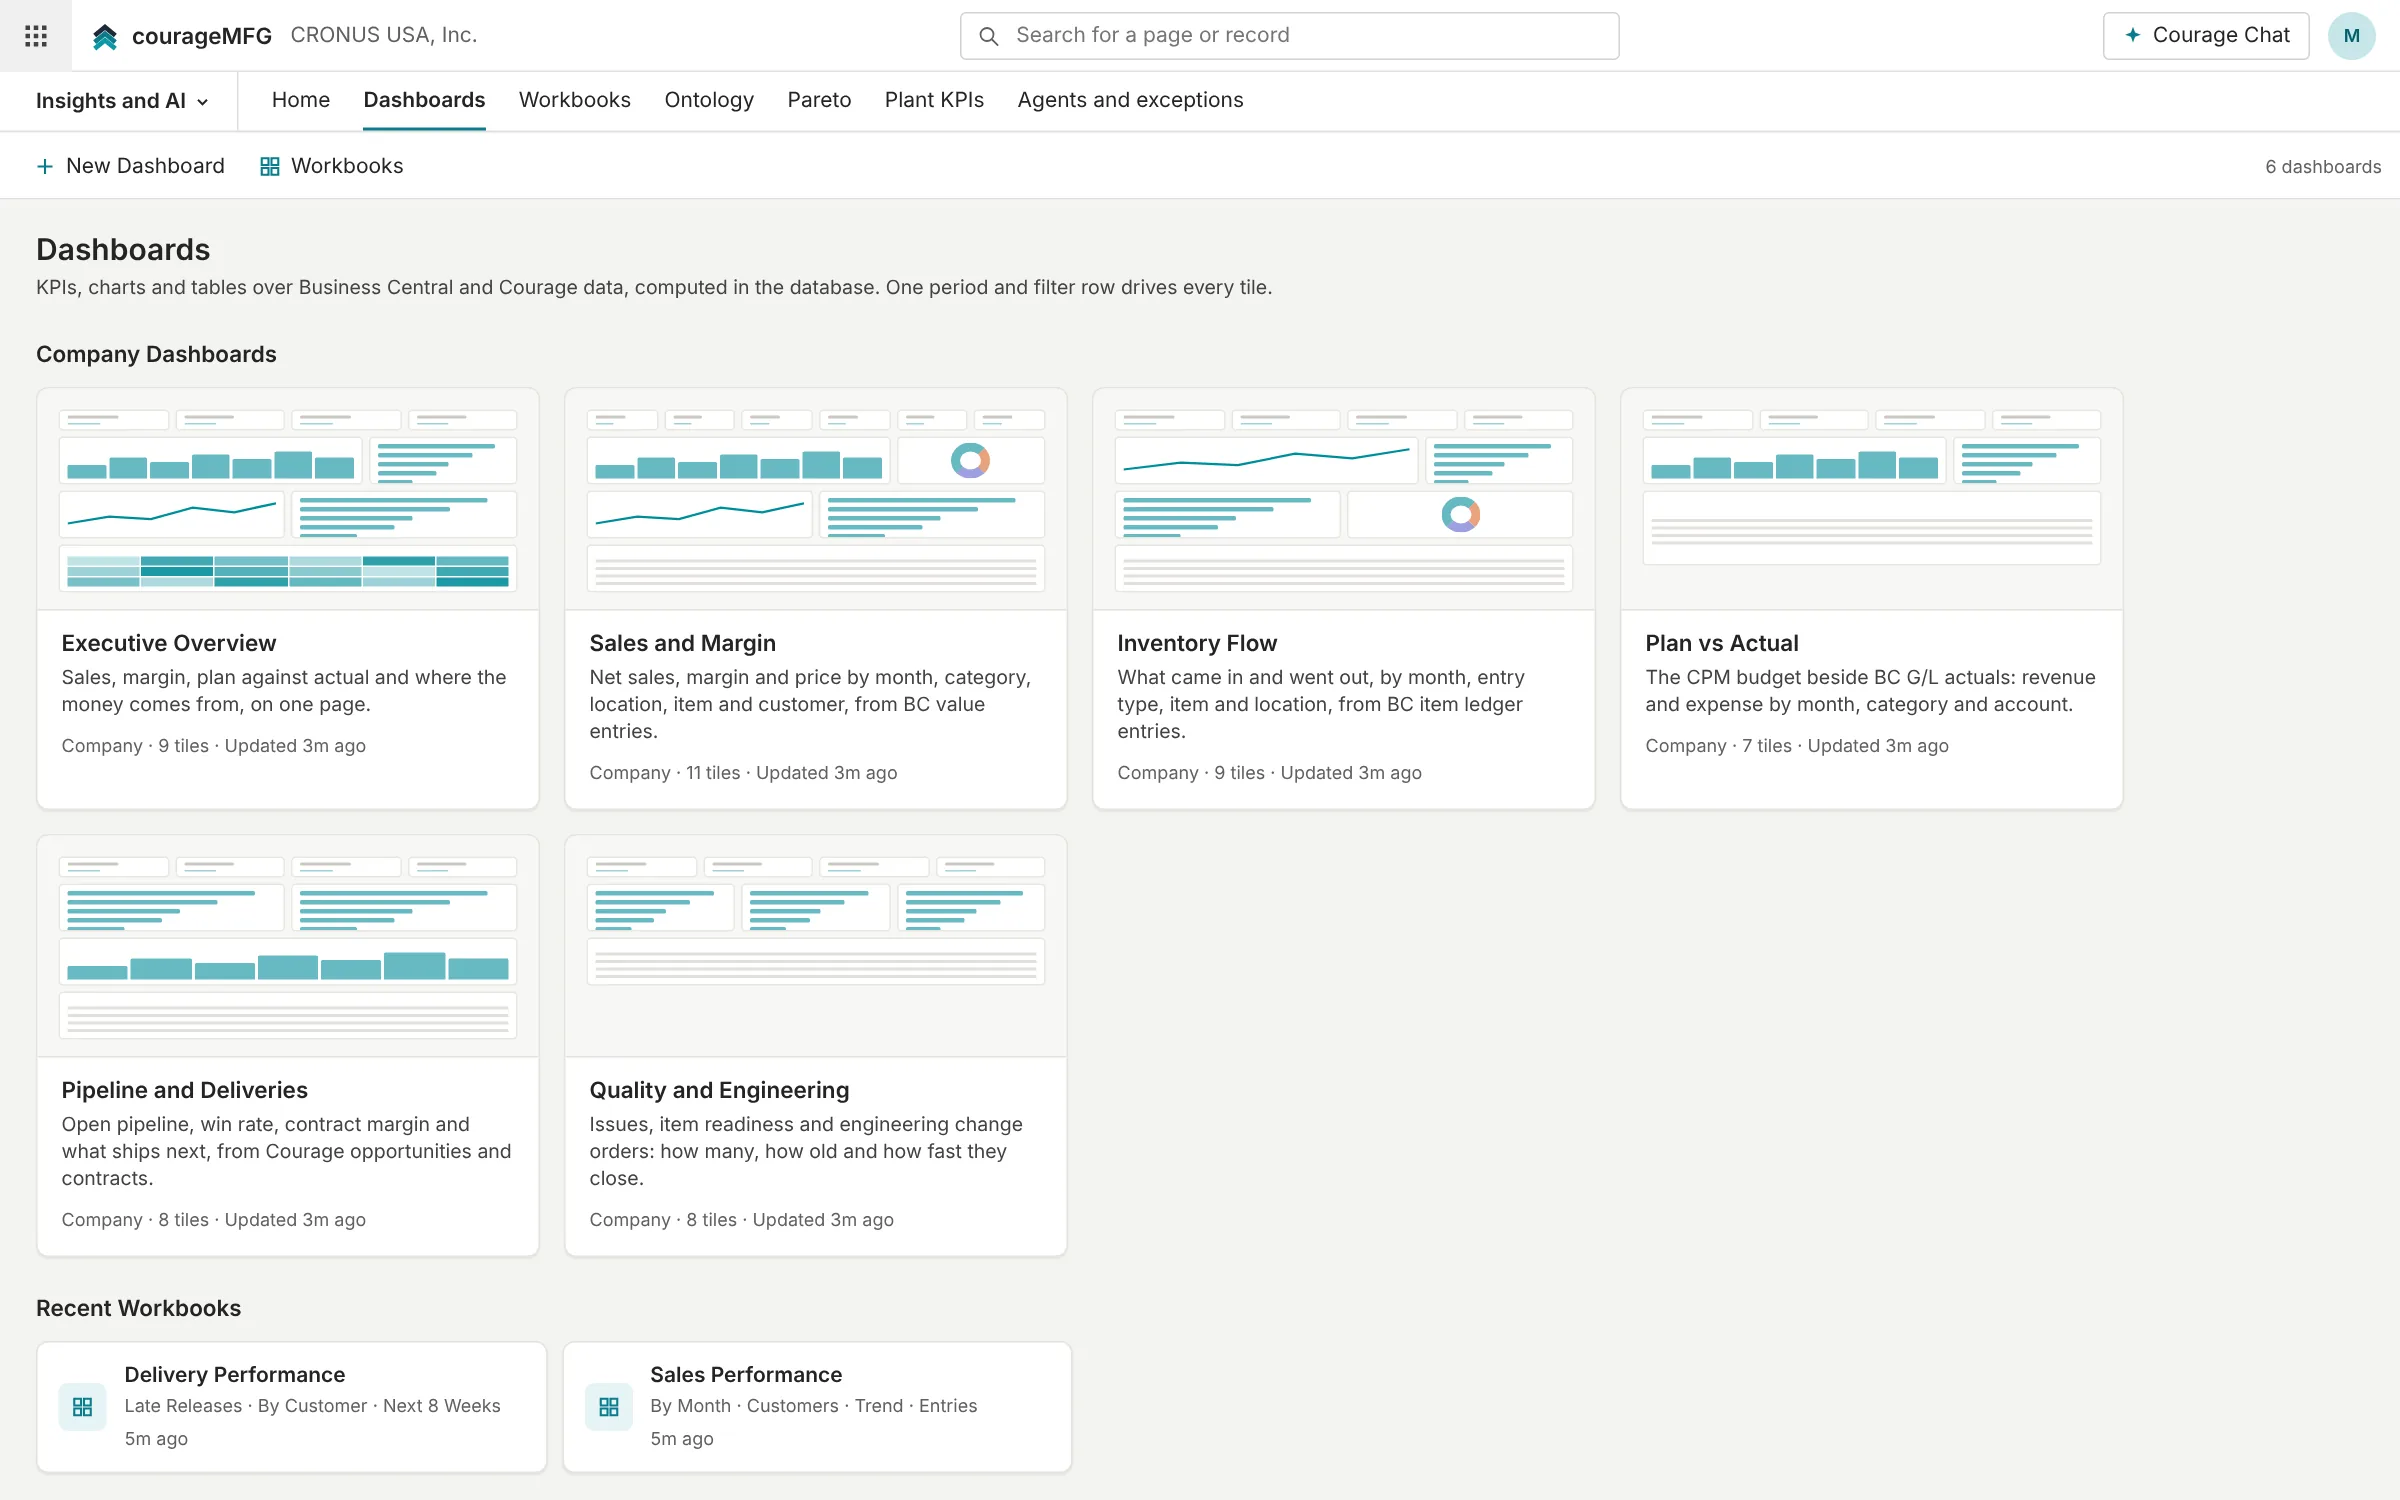
Dashboards that look the part
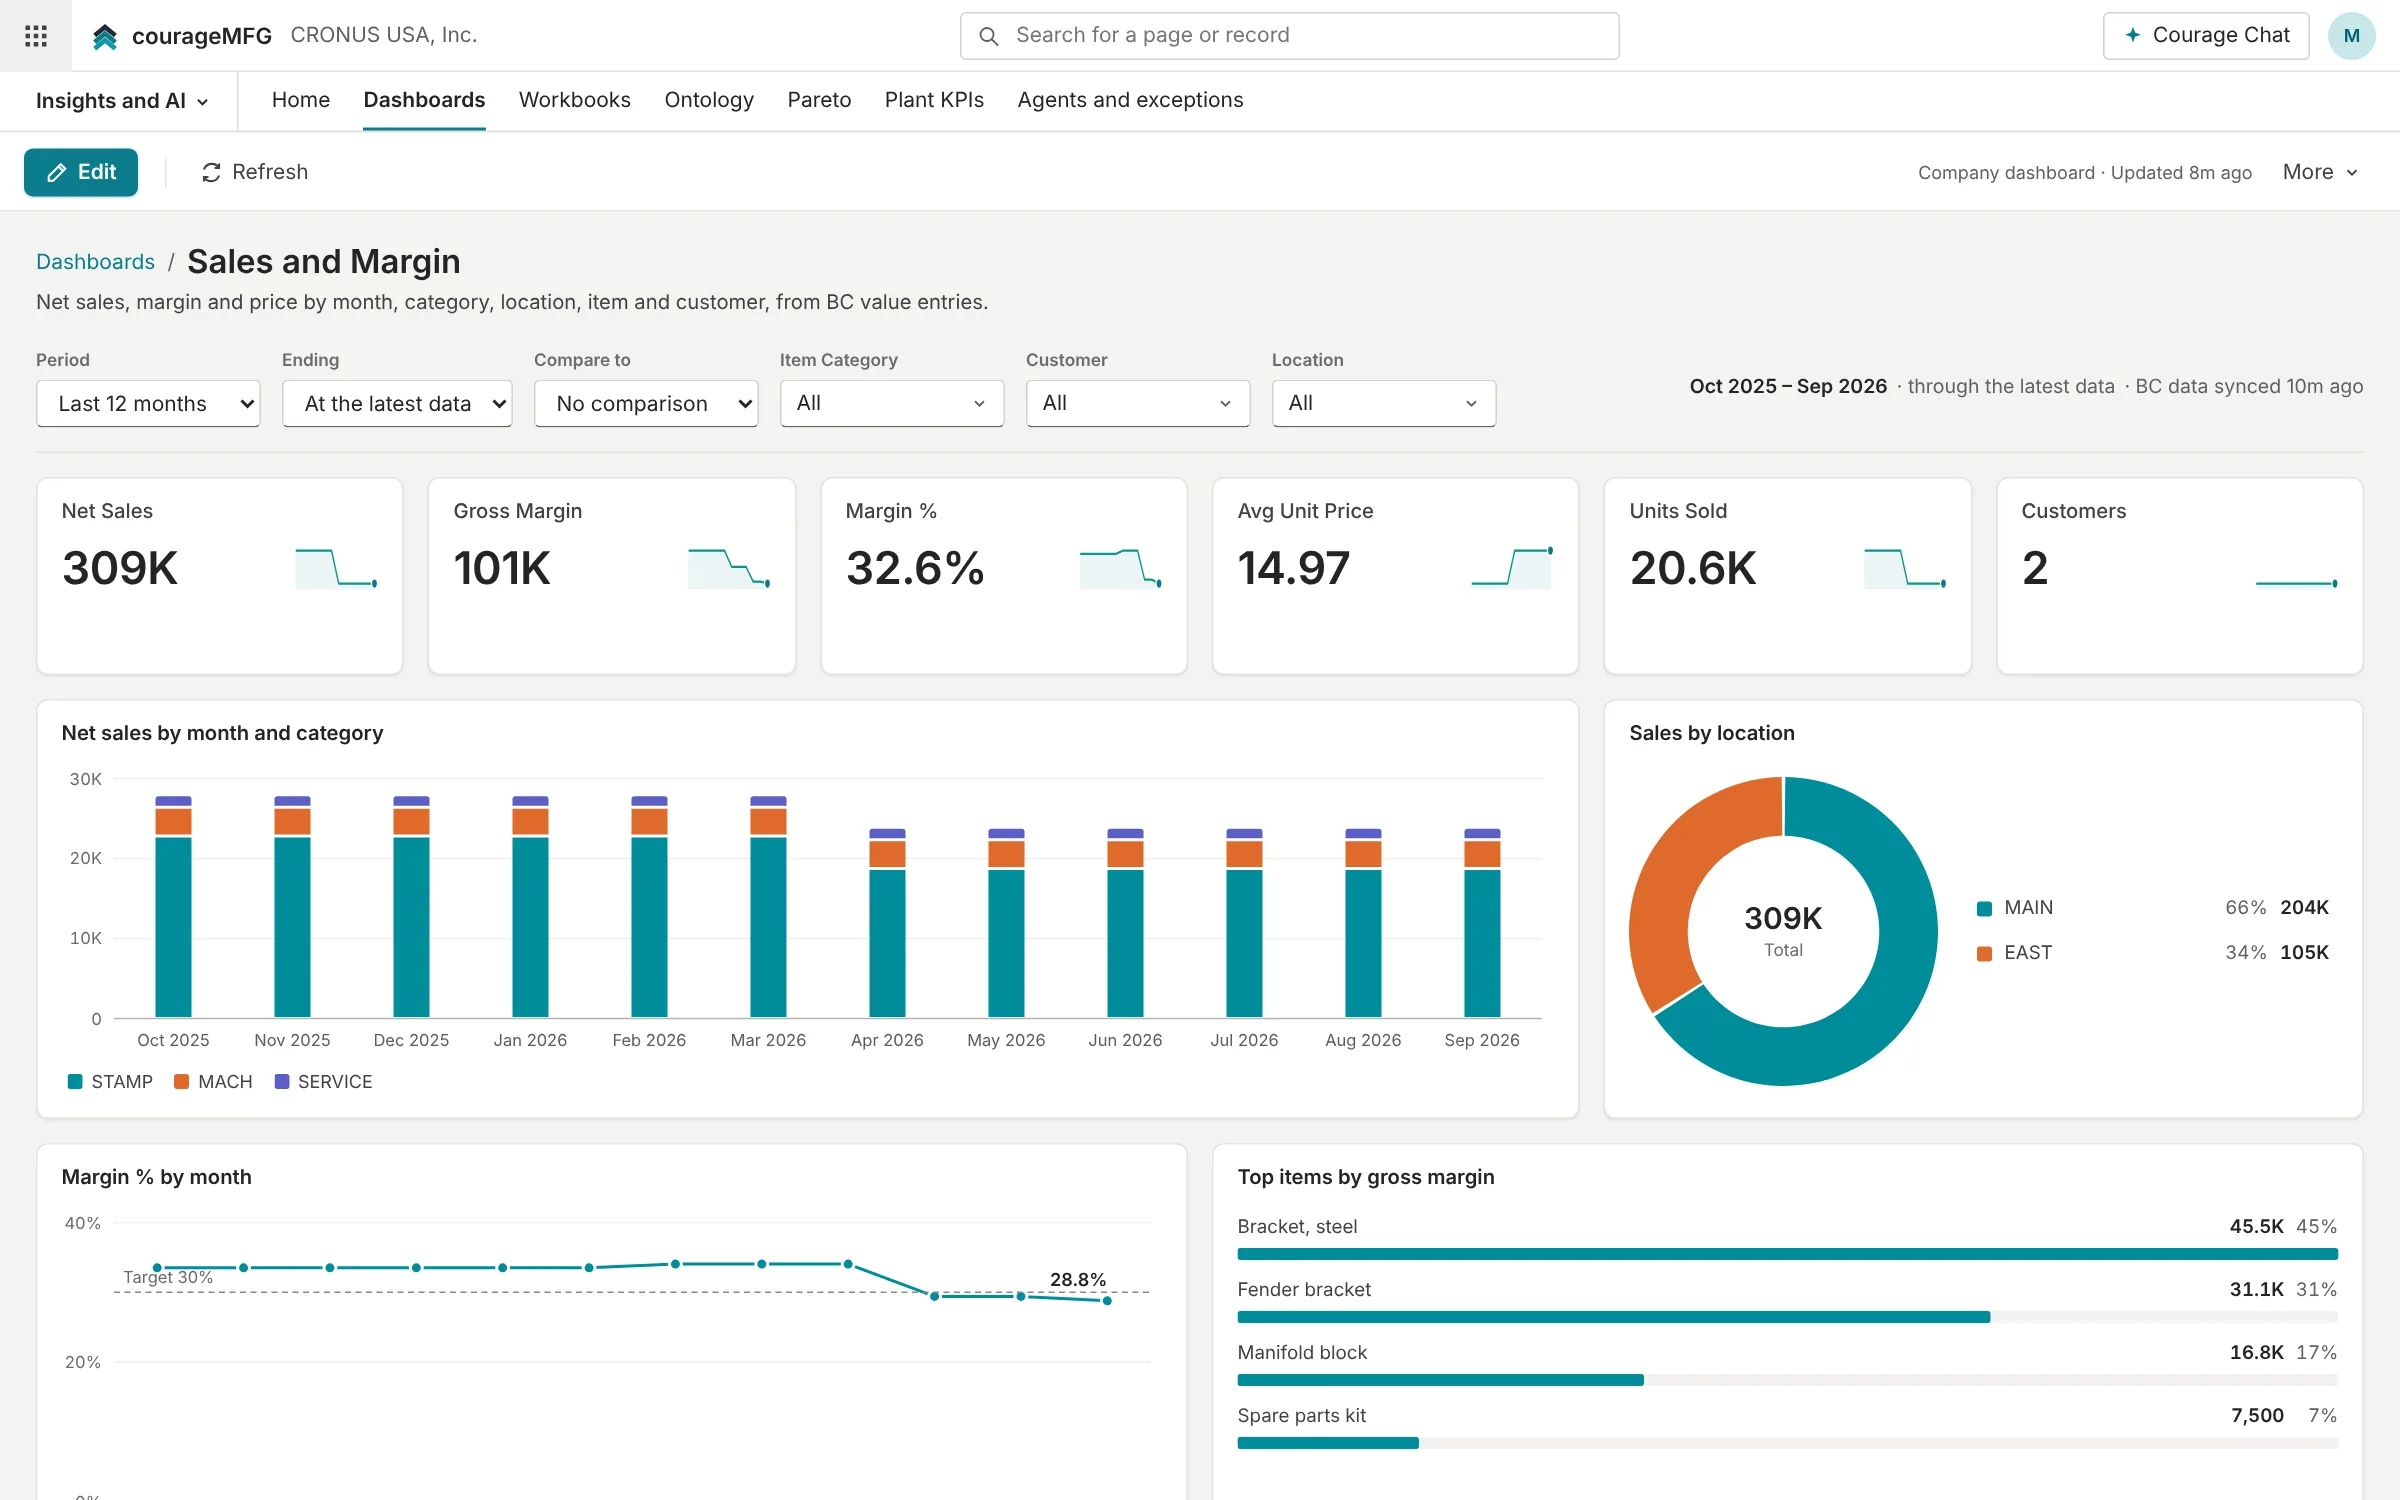
KPIs with change against prior year and a trend line; column, line, area, bar and donut charts with targets; ranked lists; tables with in-cell bars; and heatmaps. Six starter dashboards on day one: executive, sales and margin, inventory flow, plan vs actual, pipeline and deliveries, quality and engineering.
Workbooks instead of exports
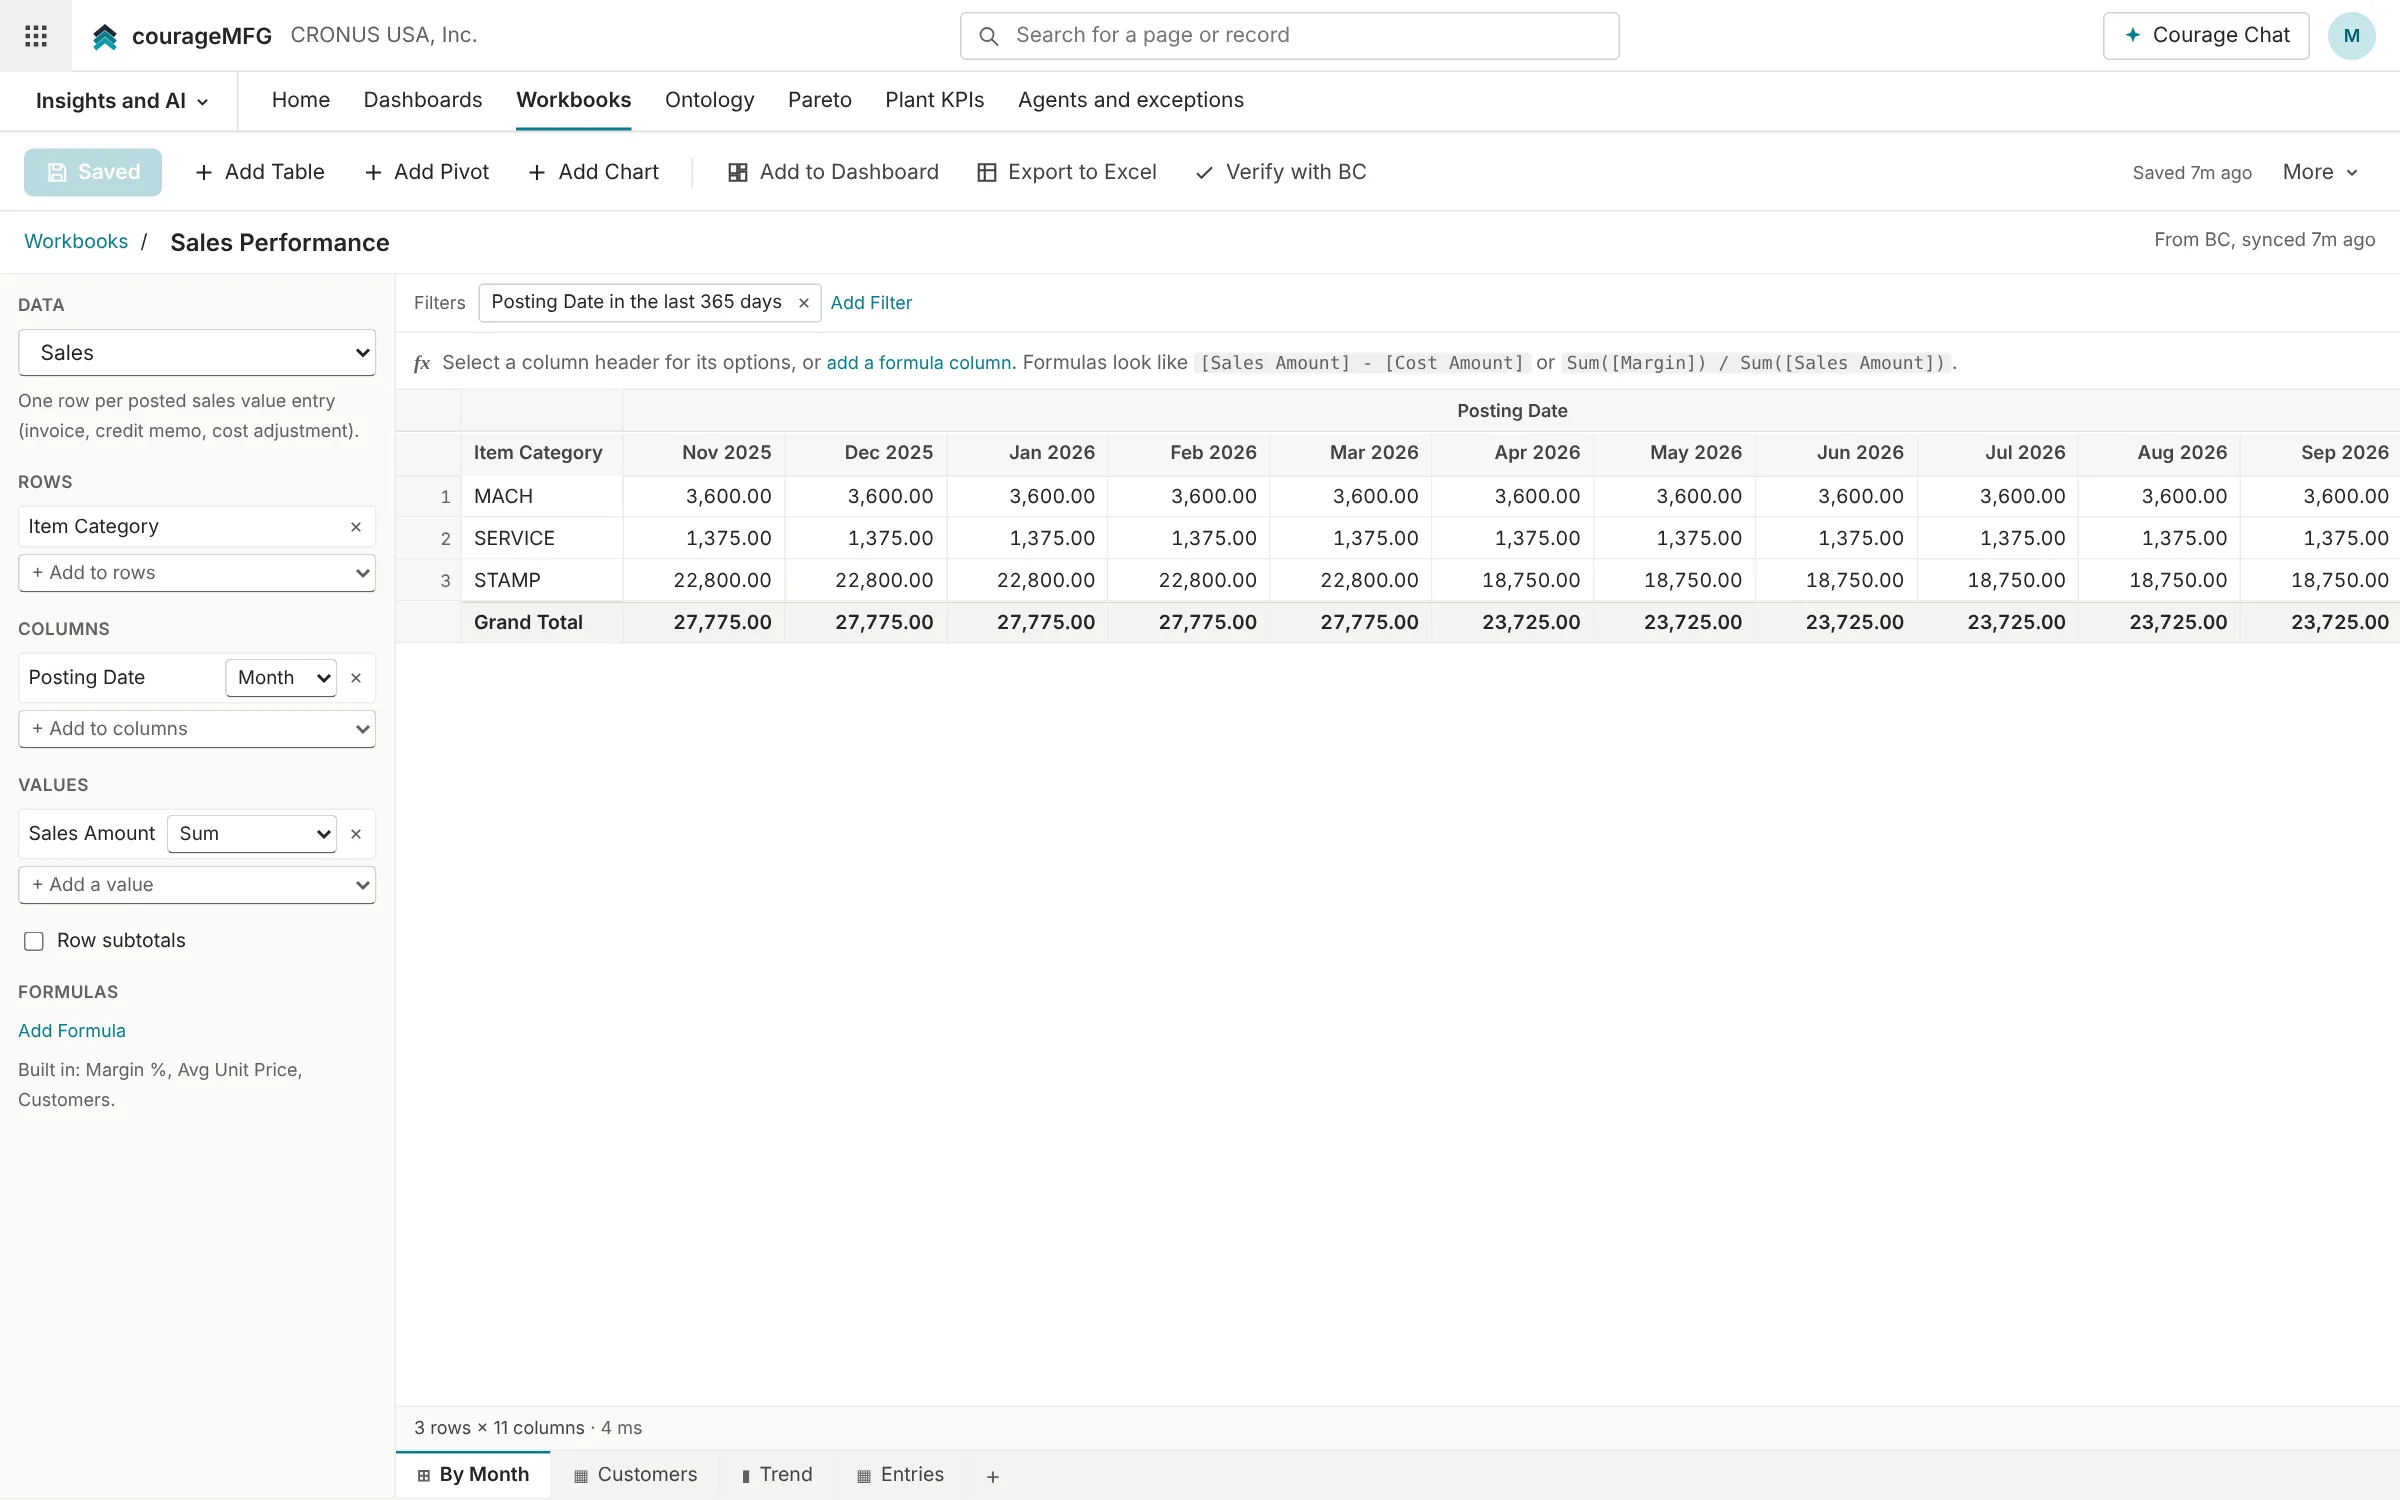
Excel-like sheets over BC and CourageMFG datasets, with pivots, formulas, filters, subtotals and charts, computed in the database so totals are exact. Any sheet can become a dashboard tile.
- Templates for sales, deliveries, readiness and pipeline
- Shared with the company or kept private
- No Power BI gateway, no export to Excel and back
Budgets and forecasts in a spreadsheet
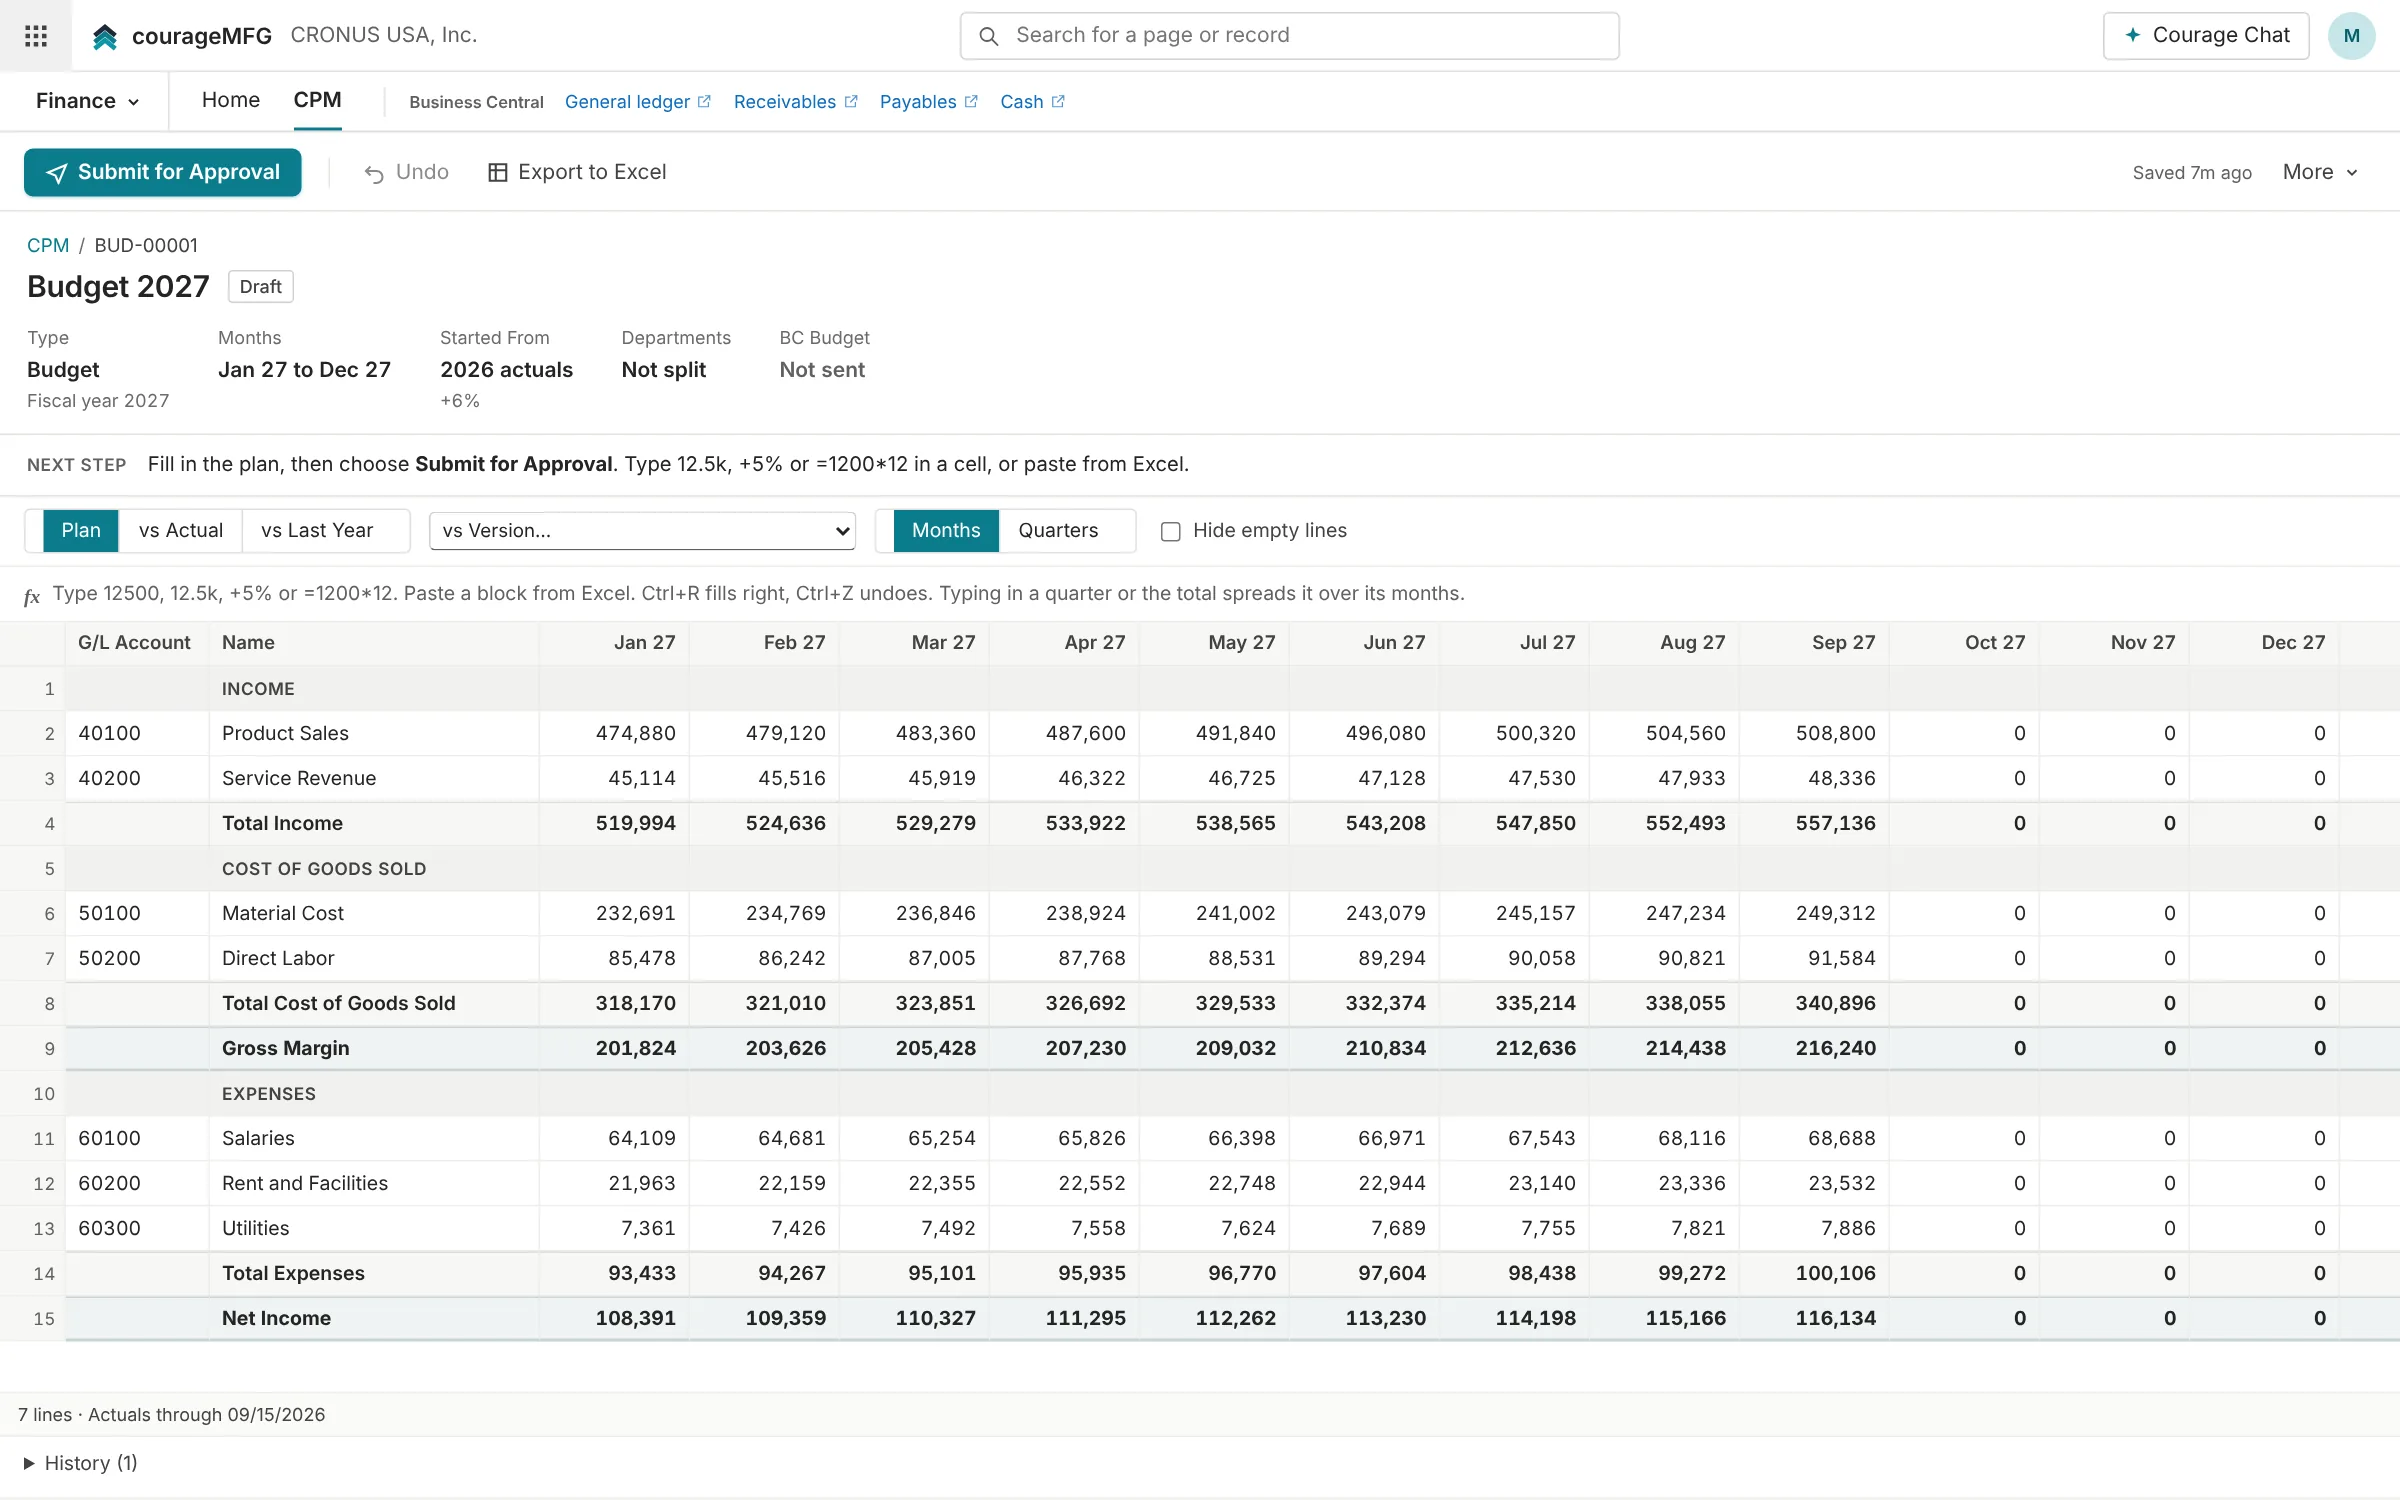
Plan by G/L account, month and department in a grid, run scenarios, compare plan with actual from Business Central, and write the approved budget back to BC G/L budgets.
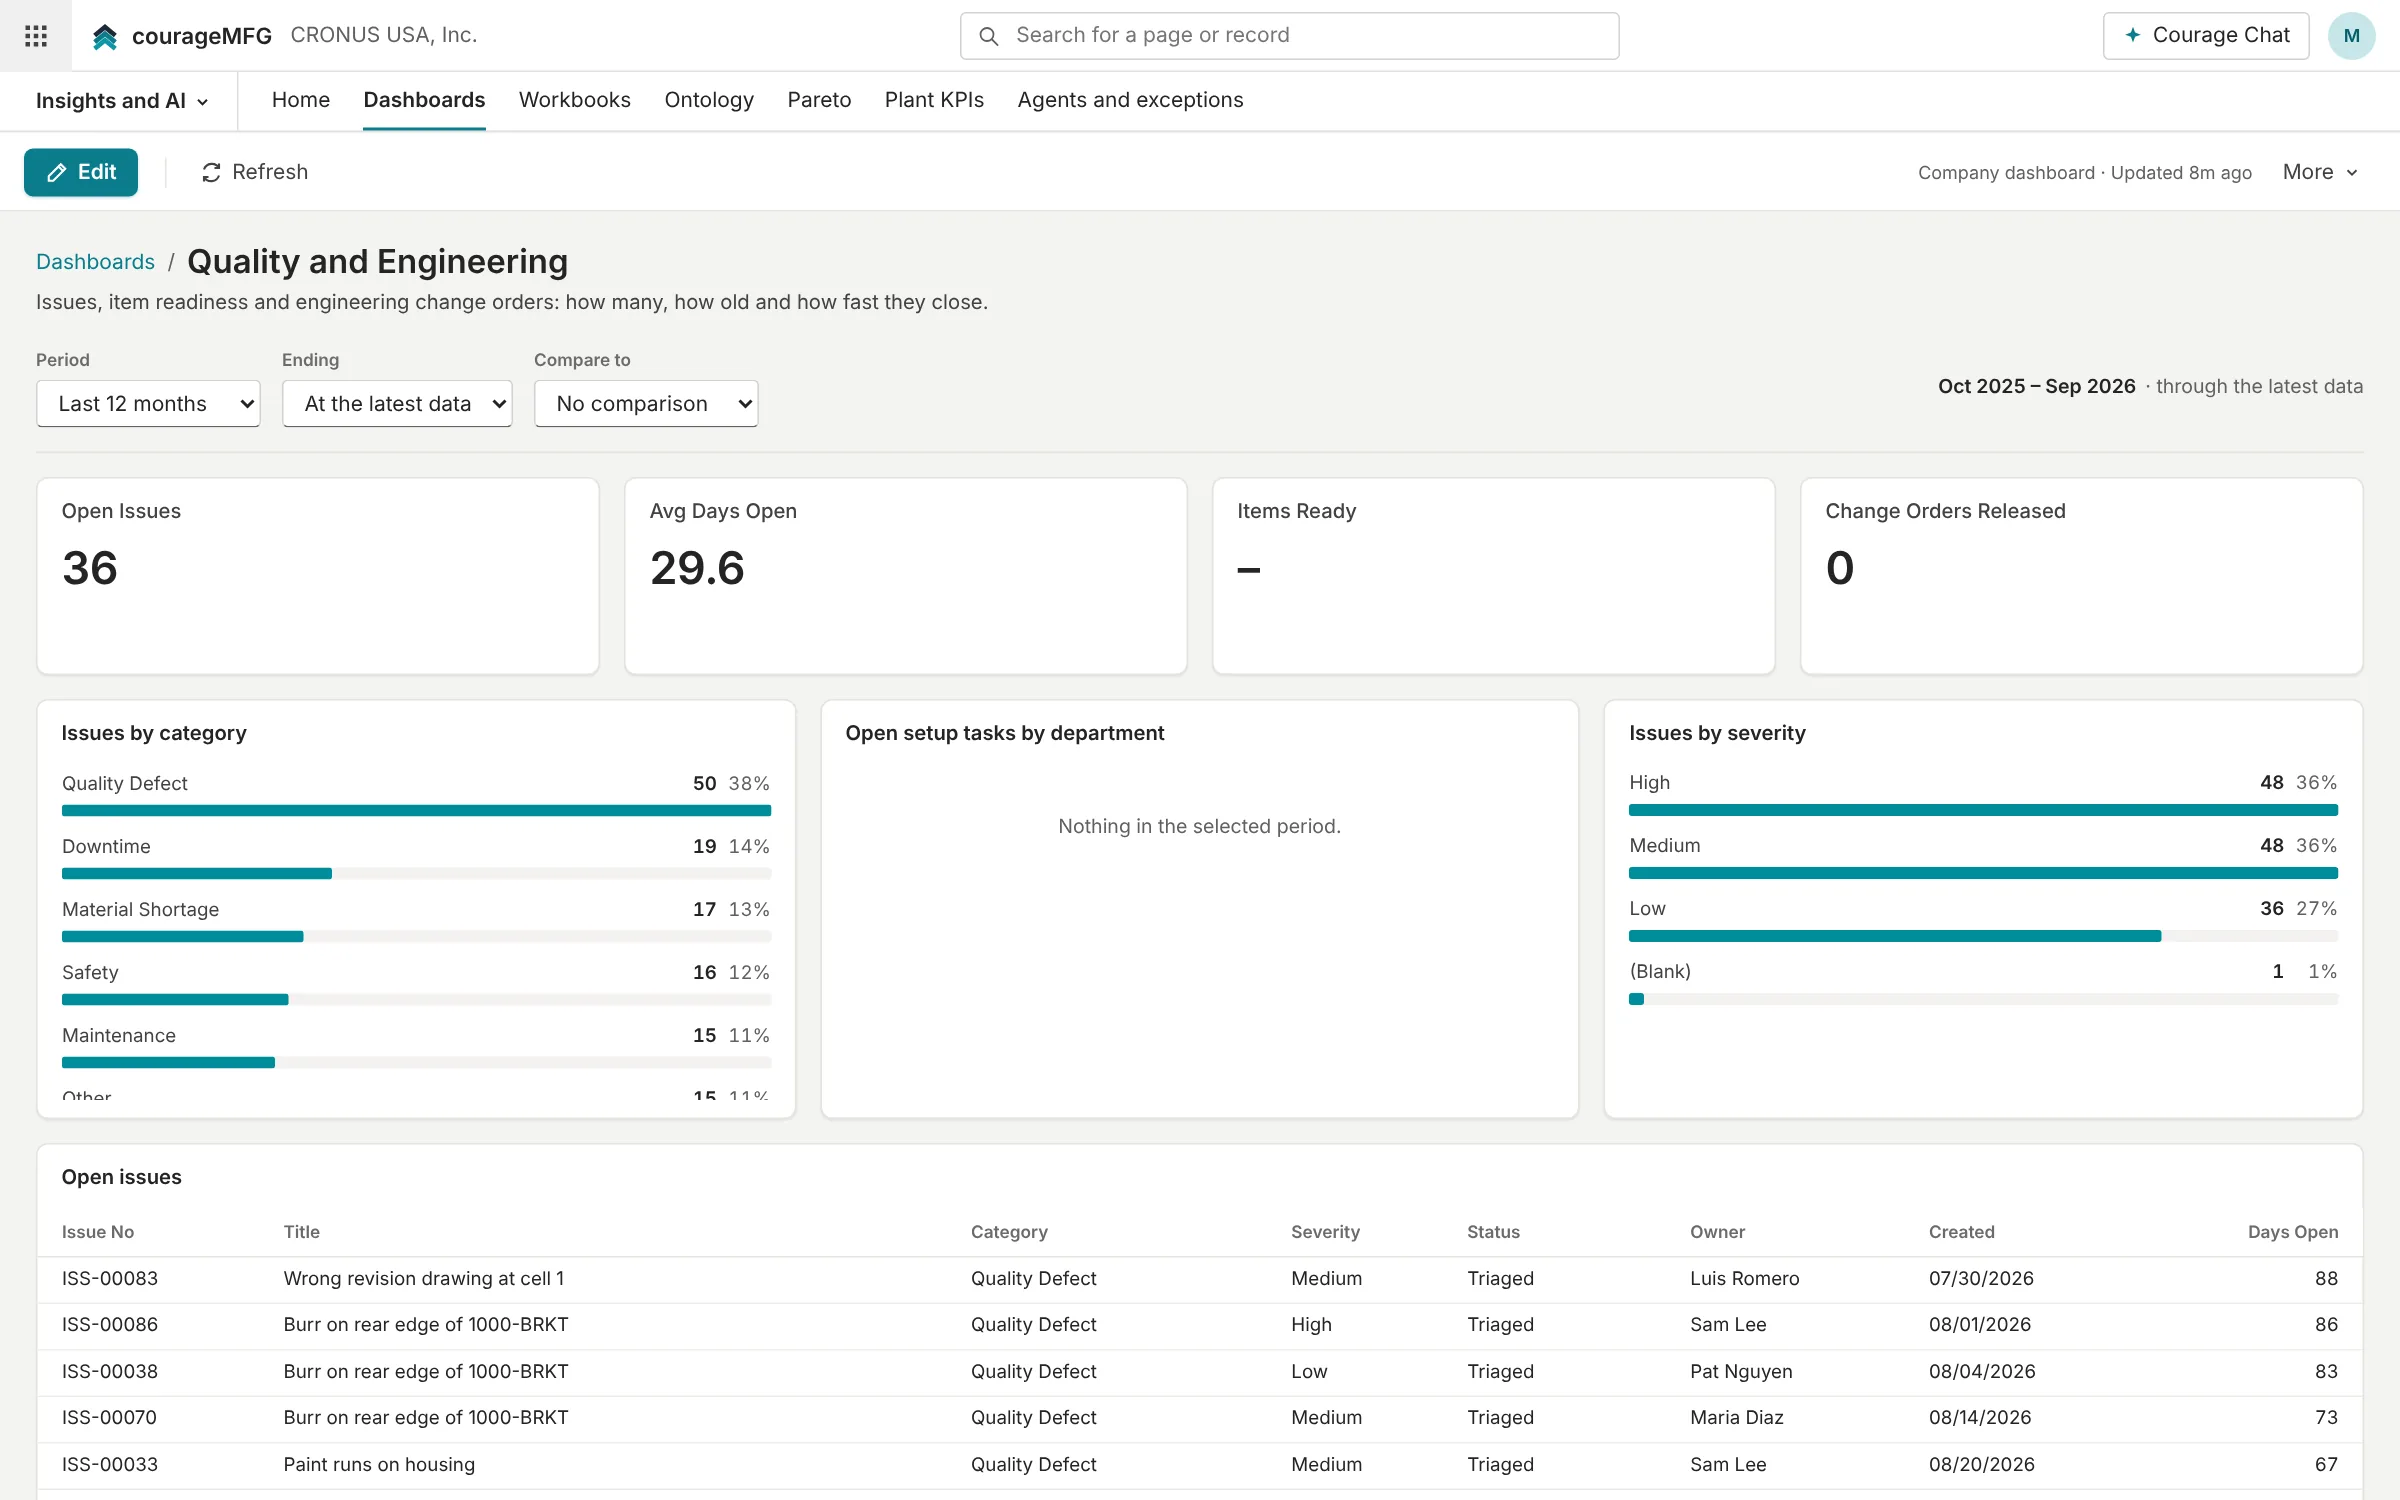
Quality and engineering on the same page
Issues by category and severity, item setups by department and change orders released, next to sales and inventory: every dashboard reads the same model. Company dashboards anyone can edit, with drag-to-reorder, resizing and a tile editor that previews as you change it.
With Business Central
CourageMFG reads what it needs live through BC's own APIs and writes back through BC's own validation, as the person doing the work.
Reads from Business Central
- Value entries, item ledger, G/L entries
- Open orders and budgets
Writes back to Business Central
- G/L budgets from approved CPM plans
The applications
For owners, CFOs, controllers and every manager with a weekly KPI deck. Each one is a view of the same records; where Business Central already does the job, CourageMFG links straight to it.
CPM
LiveCorporate performance management: budgets, forecasts and scenarios planned in a spreadsheet by G/L account, month and department, with plan vs actual and write-back to BC G/L budgets.
Replaces budget spreadsheets and a separate CPM tool
Dashboards
LiveKPIs, charts, ranked lists, tables and heatmaps on one page, with one period, a comparison and filters across every tile.
Replaces Power BI dashboards and the weekly KPI deck
Workbooks
LiveExcel-like sheets, pivot tables and charts over BC and CourageMFG data, with formulas, filters, subtotals and exact totals.
Replaces Power BI reports and the Excel exports behind them
Ontology
LiveThe linked model of the plant: CourageMFG records, BC records and how they connect.
Pareto
LiveWhat's driving issues, by category, work center, vendor, item or lot.
Plant KPIs
Record appStages: On target → Watch → Off target. Fields and history on every record.
Full application planned. OTD, scrap, OEE, first pass yield and cost of quality, from BC and CourageMFG.
Agents and exceptions
Record appStages: Needs decision → Approved → Rejected → Done by agent. Fields and history on every record.
Full application planned. What the CourageMFG agents did, and what needs your decision.
General ledger
In Business CentralAccounts and journals.
Receivables
In Business CentralWhat customers owe.
Payables
In Business CentralWhat you owe suppliers.
Cash
In Business CentralBank accounts.
See it on your own data.
We'll connect CourageMFG to a copy of your Business Central and walk your team through your own items, orders, suppliers and machines.